

If you found this article because you’re working toward WCAG 2.1 Level AA compliance, start with Test #7. Pa11y-CI is the automated accessibility scanner in this list, and it’s a great place to add accessibility checks to your continuous integration. Use alongside a full-size scanner and a manual testing regimen to maintain comprehensive accessibility awareness.
The other nine tests here help you build and maintain the kind of healthy, stable website that’s easier to keep accessible over time. Think of them as the foundation your accessibility work sits on.
Editors Note, March 23, 2026: This article has been updated throughout to reflect current tools, standards, and best practices.
There are a lot of different ways you can break a website.
Some “breaks” are emergencies, issues that need to be addressed right away as they could cause a serious or visible impact on production. Others are harder to find or see; the site may look fine, but it turns out something in your code has caused a section of the site to load twice as slowly.
How would you even know?
As developers, this can keep us up at night.
This is where automated testing comes in. Automated tests check for issues automatically, and in the same way every time. They ensure that when you see something working locally and commit that code, it’s not going to break something on the live site. If something is out of order, you’ll be notified and can work on adjustments while production keeps chugging along. In fact, if you have enough tests and they’re testing the right things, you can do crazy things like automatically deploying to production, which is amazingly freeing to do.
At NewCity, we apply a number of different automated tests to our client sites, depending on what is needed. Below are ten of the most useful ones we’ve found.
Keep in mind that some of these tests are more informational — “It’s okay if this test experiences failures, just keep a log of the results so we can review them if we want to.” And others raise big red flags — “If this test fails, you’d better stop deployment.”
All of these run in Docker, so they’re super portable. For each we’ve listed what docker image we’re using, what utility or service we’re using within the container, and some info about how we use it to test our sites. We’ve also noted if the tests support the JUnit report format, which is an XML-based format that makes it easy to parse and view your test results within the CI service.
Happy testing!
#1 Checking Code Quality
- Why? Catch showstoppers and get ideas for smaller improvements.
- Docker image: php:8.4
- Utilities: php, phpmd, phpcs
- Directions: Runs across the codebase; php -l should stop the build; Codesniffer and Mess Detector are just informative
- JUnit support: Yes
This first test is just about checking code quality. This is a very PHP-centric example since a lot of what we do at NewCity is Drupal and WordPress. And it’s the only one of these ten tests that’s not running against the actual site, but rather is running against the codebase itself.
You have three options here:
- PHP’s internal linting function: This literally finds all the PHP files in the codebase and runs php-l on them to detect any syntax errors. This one should definitely stop the pipeline.
- PHP Codesniffer: You can use this to test the codebase against different coding standards. It will have opinions about things like how you use your curly braces or how you comment your code. There are a ton of different standards available, including ones for Drupal and WordPress.
- PHP Mess Detector: This can look at your code and make more general recommendations for improvements, like finding unused code, or breaking large methods down into smaller, more maintainable ones. You can choose from a wide variety of rules you want it to test against. And it will tell you what it finds.
For our usage at NewCity, PHP Codesniffer and mess detector are more informative. We check it periodically to see if there’s anything we want to adjust.
#2 Checking HTTP Status
- Why? 500 errors are bad
- Docker Image:
- Utilities: requests and lxml libraries
- Directions: flatten sitemap, request pages, check something: not 500, is a 200 / 30x
- JUnit Support: no, but can output to TAP, which can be translated to JUnit
This test has saved our bacon repeatedly.
Here we’re using a simple python script to verify good http statuses across the site, confirming that no server-side errors are raised by any new code.
In short, we grab all the URLs in the sitemap and check each one of them to make sure it’s working on the test site. The version of this that seems to work best for us is just verifying that all those pages are not a 500 error.
We’ve also done versions of this where we made sure it IS a 200 or some kind of redirect, and we’ve also used a version that checks inside the page markup for a canonical metatag on each page.
If this test finds anything, it should absolutely stop the build.
#3 Verifying Page Content or Behavior
- Why? When things break, they should only break once
- Docker image: cypress/included
- Utilities: cypress
- Directions: write some baseline tests; add tests as issues you don’t want to see again get resolved
- JUnit support: yes
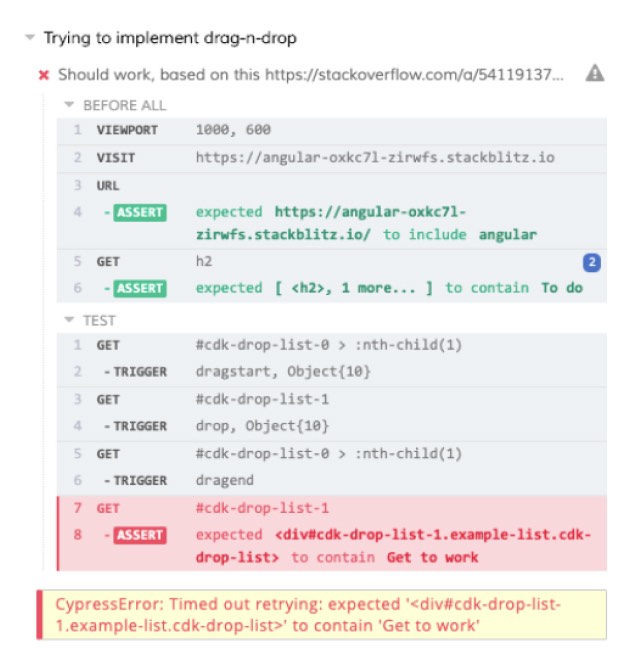
This is pretty classic end-to-end testing of your site. Here we like to use Cypress, which is a testing tool that will manage browsers on your behalf and test whatever behavior you want to make sure is working on your test site.
For instance, if you want to make sure that a particular page always has a list of items in it, you can visit that URL and use CSS selectors to find that list and count the number of items and fail the test if they don’t exist.
End-to-end testing is particularly useful if you regularly add tests as you fix reported issues; this will ensure the same issue doesn’t recur in the future.
This is also similar to Nightwatch or Playwright, which are both also excellent. All of these tools let you write tests that run against a real browser, making them reliable for catching regressions across your full stack.
#4 Scanning for Broken Links
- Why? Broken links bum your users out (and also the search engines).
- Docker image: python
- Utilities: linkchecker
- Directions: feed an entry URL
- –check-extern
- –no-robots
- –user-agent
- get csv/html/xml/sql output
- JUnit support: yes
This is an oldie but a goodie. As you know, over time, entropy will slowly degrade the links on your site. As people change content, or as the world changes around your website, broken links invariably creep in, and that can negatively impact your rankings as well as sadden your users.
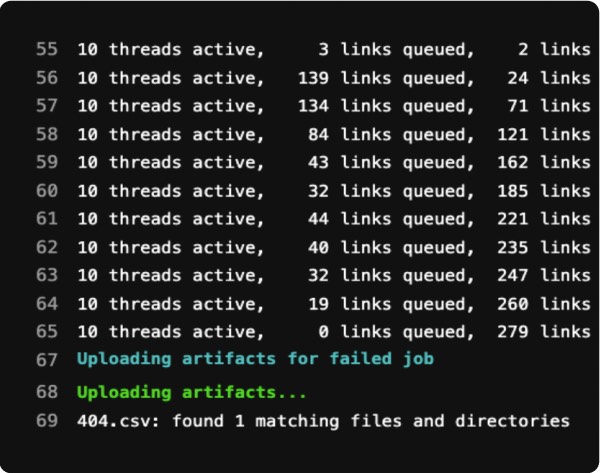
To this end, we can use this great Python utility named “linkchecker” to check our links. You can feed a starting URL and it will crawl your site for broken links and report back what it finds.
You can tell it to check or not check external links, ignore robots.txt if you’re working on a dev site, and can even impersonate a browser user agent if needed. In the end, it generates reports in a whole variety of formats that you can save as artifacts or send places as needed.
This one definitely is on the informative side for us, and is a great candidate for just installing locally and running from time to time.
#5 Checking for Visual Regressions
- Why? Make sure you’re only breaking what you expect to break.
- Docker image: backstopjs/backstopjs
- Utilities: backstop
- Directions:
- define live and test hostnames
- feed list of URLs to compare
- junit output, zip file of screenshots/diffs as artifacts
- JUnit support: yes
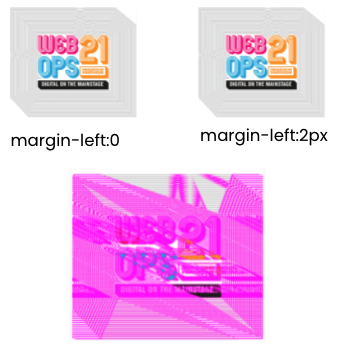
Visual regression testing is a great way to verify your new code hasn’t changed something a bit more subtly, or “make sure you’re only breaking what you expect to break.”
At NewCity we use Backstop.js but there are a number of different tools and services that can do some version of this.
In a nutshell, you can feed it a number of different URLs and it will take a screenshot of the live version and the test version and then identify all the places the pixels are different in the two screenshots, highlighting them in pink.
If you did something that really shouldn’t change the page, like upgrading a minor version or applying a security update to something, there really should be zero difference, and it’s really good to know if there is a difference.
For the pipeline, you can set the percentage difference you’re willing to live with and it will fail the test if it exceeds that.
#6 Browser Screenshots
- Why? Ensure your site renders on the CEO’s machine.
- Docker image: python:3
- Utilities: CrossBrowserTesting screenshot API
- Directions:
- define a url list
- define a browser/device list
- receive data about test results and do something with it
- JUnit support: no
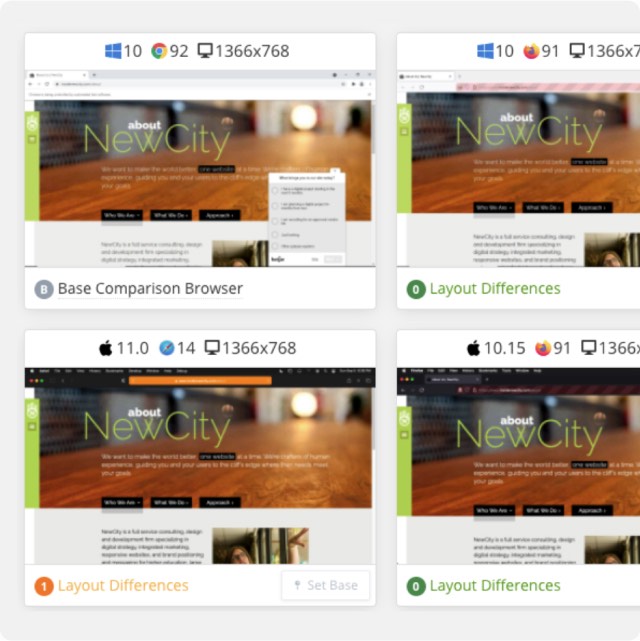
In a lot of the projects we do, we have an agreed upon list of browsers and devices that the site we build should work on.
BrowserStack is a paid external service that is great at helping us verify cross-browser rendering across a wide range of real browsers and devices.
The way this test works is that we create a list of URLs that represent all the different types of general page structures, then use the BrowserStack Screenshots API to capture each URL across our defined browser and device combinations. The API returns URLs to each screenshot, which you can save as artifacts or bundle and send somewhere for review.
BrowserStack’s documentation includes well-maintained API examples in multiple languages, making it straightforward to integrate into your CI pipeline. Other good alternatives include Lambdatest and Saucelabs.
#7 Checking Accessibility
- Why? You’re a decent human being.
- Docker image: buildkite/puppeteer
- Utilities: puppeteer, pa11y-ci
- Directions:
- grab sitemap
- grab sitemap
- test against WCAG 2.1 Level AA (the standard adopted by the DOJ’s updated Title II rule)
- generate html report
- use Puppeteer to manipulate pages, test after DOM has changed
- JUnit support: yes, as a plugin
Pa11y-CI is an awesome test runner built around pa11y, which itself is a great accessibility assessment tool. You can select the standard you want it to test against, like 508 or WCAG AA, and then test URLs to get all kinds of information about how you can improve the accessibility of those pages. As with a number of our tests, we usually grab all the URLs in the sitemap and then test each of them with pa11y-ci.
One of the really nice things about Pa11y-CI is that it can work with Puppeteer to control a browser and then run your Pa11y tests on the page in whatever state you’ve left it in. So you can test things like a mega-menu, but only after it’s been expanded; or a react component but only after you’ve interacted with it.
Another widely used option worth knowing about is axe-core, the open-source accessibility engine from Deque. It can integrate with Cypress and Playwright via axe-cypress and axe-playwright libraries, making it easy to add accessibility assertions alongside your existing end-to-end tests. Pa11y and axe-core complement each other well — running both gives you broader coverage and helps reduce false negatives.
It’s worth noting that automated accessibility testing only catches maybe half of accessibility issues, and also generates false positives, so be sure you’re augmenting this test with manual testing as well.
#8 Tracking Core Web Vitals

- Why? Fast website better than slow website.
- Docker image: cypress/browsers
- Utilities: lhci
- Directions:
- add URL array to .lighthouserc.js
- view results on Google storage
- create assertions if you want to stop the build
- Lighthouse-CI server for long-term storage / trends
- JUnit support: no
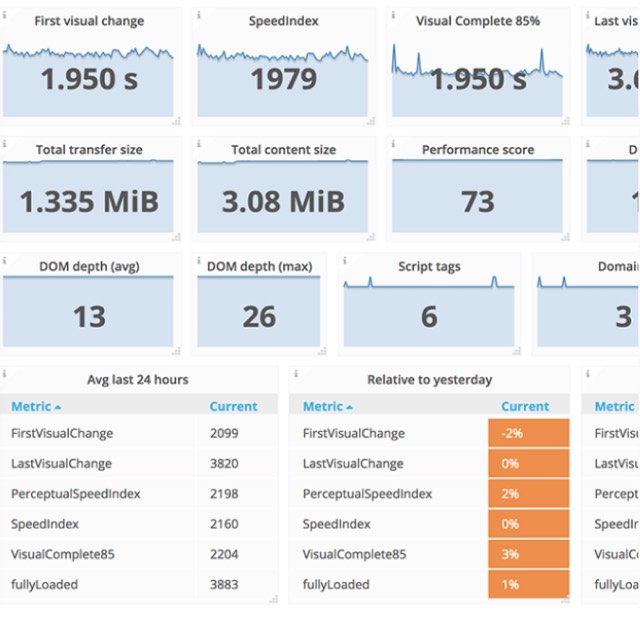
So you’ve probably seen Lighthouse in the Lighthouse tab of Chrome DevTools. This test provides a way to generate Lighthouse tests from within pipelines. We started using this because we needed to keep close track of Google’s Core Web Vital values for a project, and this made it easy to measure those every time we modified our code.
The easiest way to set this up is purely informational. You can feed it a URL and it will create a public report on Google storage that will last for a week. The URL is output into your CI logs and you click through to look at things. But you can also set assertions on most of these values, like minimum scores or max values, and have your pipeline fail if it doesn’t meet those thresholds.
Additionally, Google has a suite of tools called Lighthouse-CI Server that you can set up on hosting you control and your pipeline can deliver the test results to that server. This will then store the values long-term instead of on Google’s temporary storage, and also help you visualize trends in your scores over time.
#9 Assessing General Performance
- Why? Fast websites! Still better than slow websites.
- Docker image: docker:dind
- Utilities: sitespeed.io
- Directions:
- run sitespeedi.o against a list of URLs
- set a budget.json for assertions
- pull in other services!
- can send data to Graphite monitoring for trends
- JUnit support: yes
This next test will let you assess the performance of your site — but with even more numbers! Sitespeed.io (which is both the name of the utility and the URL of the site) is a Swiss Army knife of tools that will report all kinds of stuff about the performance of your site. Things like: timings, page weight, information about the complexity of your markup, and much more.
There are also a ton of different plugins you can add to extend the functionality — it can fold in results from other services like Webpagetest, Lighthouse, Pagespeed Insights, and so on.
For your pipeline, you can create a JSON file in which you can set assertions on any of the metrics it pulls in, even the ones from external services. This lets you do things like break your build if your page has too many assets, the page weight is too large, or it loads too slowly. And if you send the results to a hosted Graphite instance you can visualize trends in those numbers over time.
#10 Spellcheck

- Why? No reesun, why do you ask?
- Docker image: alpine
- Utilities:
- Aspell, grep,curl
- Directions:
- grab sitemap
- download HTML of each page, pipe to aspell
- clean up results
- JUnit support: no
This was historically part of our launch checklist prior to a site going live, but it’s nice to have something to check with as content changes over time. This is a good one to set as purely informational and even to have it run on a schedule and then periodically check the results and fix things.
The only downside to this one is that it tends to recognize proper nouns as misspelled words. You can feed it a list of allowed terms, but I usually filter out capitalized words, which is okay as long as no one ever misspells the first word of a sentence. Either way, this does tend to find a few things on each site, so it does its part in the neverending fight against entropy.
In our example, we just grab all the URLs of the sitemap, download their HTML with CURL, and then run Aspell on the source code. It has a mode in which it can scan HTML documents and does a good job of not picking up markup.
We then compile the results into a text file that we can output to the CI logs, make available as an artifact, or send somewhere.