
Working with Google Analytics is often the easiest thing in the world. It’s a great plug-and-play tool that gives us access and insight into what’s happening on our websites. The cool thing about it is that it’s completely agnostic too; it doesn’t care what kind of website you have, only that the tracker is installed and users are viewing pages.
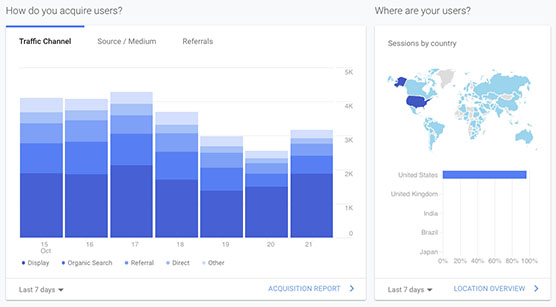
From there, you’ve got access to metrics like pageviews, sessions, users, bounce rate, and average page load time; plus dimensions like source / medium, device category, landing page, and browser. All without having to do any customizations. There’s a lot of power right out of the box.
But the honeymoon is short. Outside of checking up on newly published content or the odd campaign, the average Higher Ed analyst doesn’t get much from a generic Google Analytics setup. Why is this the case? Why does Google Analytics seem like such a powerful tool, but we consistently feel like we’re not getting the most out of it?
The simple truth is that Google Analytics is just not built for higher ed. It’s made for, optimized for, sold to, marketed at …. ecommerce. So where does that leave us? Should we just accept the limitations of the tool, or worse still, accept a limitation on our ability to analyze our traffic?
A resounding NO is the answer! So what if Google built their tool with an e-commerce vocabulary? So what if metrics talk about revenue, price, and value; or if dimensions refer to transactions and products? We are not barred from using them just because of the language. All we need to do is think a bit differently about our content, massage the data we give to Google and we can leverage tools that we already use to add value to our reporting.
This may sound familiar
You’ve got lots of traffic coming to your site. You built it so it would be useful to students, faculty, staff, family members, prospective students; you might even have information for the community at large. A lot of the traffic probably comes through the home page. Which is totally normal. If anyone knows the name of your institution, they’ll pop it in Google, and if Google plays nice, they’ll get the homepage as the first result. If this is not the case, that’s a different blog post altogether.
If your homepage is like a lot of other homepages out there, there’s likely a main navigation ready to send your users to various sections of the site to consume the content you’ve meticulously created, placed, and tracked.
You might even have some user actions that are really important to your institution. They’re likely forms of some sort, and they’re likely buried a few pages deeper than the homepage. For those of you concerned with prospective students, those forms are usually for three very important functions: requests for information, scheduling a campus visit, and applying. Others of you might have some really cool form we don’t know about, but would love for you to share with us!
Regardless, what you have is basic to almost every website out there: You’ve got entrance points, you have content, you have a funnel, and that funnel leads to user actions or goal conversions.
If you’ve set these goal conversions up in Google Analytics (please, please, please tell me you’ve set up goal conversions!) you know about goal completions and goal conversion rate. Those metrics are your gold. You probably work to improve them. You wonder how. You wonder why. Eventually, you start to dig. You see that landing pages can be linked to goal conversions.You see that traffic sources can be linked to goal conversions.
You probably start to wonder, well what about all the other content on the site? I mean, we don’t just have landing pages and forms. There’s a lot of other really good content on the site.
Still though, users enter, they navigate around, they find the forms, and hopefully they convert.
In an ideal world.
And in that ideal world, wouldn’t it also be ideal to know what content contributes to those conversions?
Which pages contribute to goal conversions?
For each user action, for each goal conversion, there is a lot of content that can be a piece of a pathway. There’s a lot of supporting material out there that may not be getting credit for what it does (or maybe getting too much credit for what we think it does).
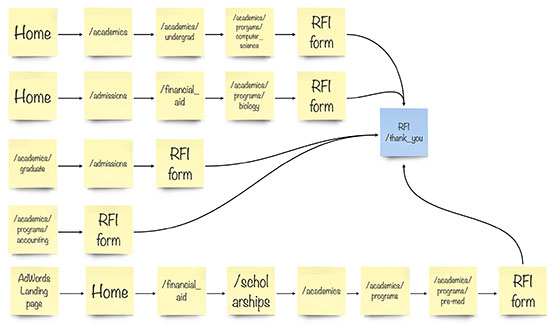
Why is that? Well, simply put, when Google Analytics records a goal conversion, it does so in the context of the entire pathway. It is only capable of attributing a goal conversion to the entrance point of that pathway. Everything between the start and the finish gets ignored.
If you try and ask, “what’s the goal conversion rate for page X,” Analytics just looks at you and shrugs. Like it didn’t understand what language you were speaking. So how exactly can you determine which pages contribute to goal conversions?
Nobody knows!
Well, that’s a slight overstatement, to be fair. There are a couple of ways analytics can try and help us, but the results are going to be frustrating.
You can add funnel steps to goals that end on specific pages. Great! Let’s just type in the ideal funnel and our problems are solved. Even if we did manage to find the perfect funnel that all users had to go through, Google does something excruciating with their funnel reporting.
If a user skips a step in the funnel, Google backfills the data. For example, your funnel is: Enter on Page A, visit Pages B, C, and D, then convert on page X. Let’s say a user enters on Page A, visits D and converts on X. Google Analytics will count Pages B and C as being viewed despite the user only visiting Page D. Nix that.
We could then try and create a goal for each funnel, something that would drive us equally crazy considering the infinite possible pathways. Not to mention you’ve only got 20 goal definitions at your disposal. You’re going to come up against some pretty strong limitations fairly quickly.
But wait, what about custom segments? They say you can do just about anything with a custom segment. Well they’re wrong. (At least in this case.) Try creating a segment of all users that converted and saw page D and you’ll get garbled mess of nonsense as a response, especially if you want to look at a sizable portion of data. Remember, Google Analytics can only marginally understand what a pageview is if you ask it specifically about goal conversions.
All it can reliably tell us is where a goal conversion starts. Period. The end. Game over. Do not pass go. Certainly do not collect $200. In fact, go straight to jail.
There must be a (better) way!
Ok, I got carried away there. You don’t have to go to Analytics jail. The problem is simple. User enters. User views pages. User converts. Connect the dots. There has to be an easy-ish way to link “user views page” to “user converts.”
There is in fact!
Actually, there ARE in fact. There are 3 unique ways to do this (probably more, but 3 always sounds the best in any list).
The first is called Page Value. This is the easiest solution to the problem. It’s almost too good to be true. You do one little thing to your goal conversion and boom, you’ve got your answer.
Also, because it’s the easiest, it gives us the least information. It’s just one little metric. One great little metric, but one little metric nonetheless.
The second solution is the magic word: Ecommerce. This is an entire library that comes standard with Universal Analytics. It takes a bit more effort to implement than Page Value, and you’ll need more skill to get it right. But man is it worth it.
The third solution is the reason I’m writing this series. I’m saving the best, juiciest, most awesome solution for last. It’s a customizable, contemporary, quality solution to the problem of pathways. Enhanced Ecommerce is easily the most powerful free library Google offers to free Analytics users for free. Also did I mention it’s free?
Because it’s free and awesome, it can also be a pain to get up and running. But nothing that’s worth it is easy, right?
In the following parts of this series, we’re going to explore how to get all three of these solutions working in your Analytics accounts today, with the minimum effort necessary. How far you take them beyond that is up to you.
Check back for Parts II, III, and IV!